
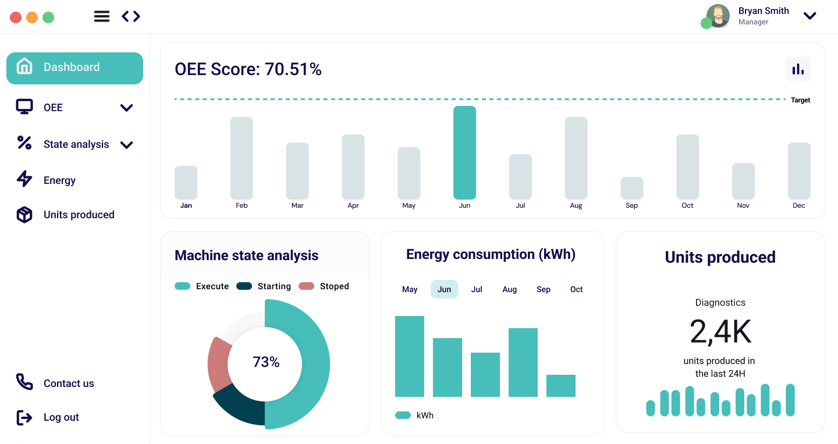
OEE Performance
Monitor OEE performance of machine fleet by combining data of multiple agents.
Contact StriData


.svg)
Combine data from multiple machines to track Overall Equipment Effectiveness (OEE) across your entire fleet. Identify underperforming assets and monitor efficiency trends over time.
Machine Performance Over Time
View historical trends in key machine metrics such as runtime, idle time, and cycle counts over days, weeks, or months.
Downtime Analysis
Track machine downtime events, durations, and frequencies. Break down downtime by machine, shift, or reason code if available.
Tag-Level Performance
Monitor the behavior of specific PLC or sensor tags (e.g., pressure, RPM, energy use) to identify anomalies or inefficiencies.
Temperature Monitoring
Visualize temperature fluctuations across multiple machines or critical components in real time and historically.
Average Throughput Report
Calculate and monitor average production throughput per machine, per shift, or across your operation.
Production Time Tracking
Analyze how long machines are actively producing versus idling or stopped, giving insight into utilization.
Production Downtime Summary
Aggregate and visualize total downtime per machine or across your plant, helping to pinpoint recurring issues.
Alarm and Event Dashboards
Log and visualize alarm frequencies, types, and timing to support root cause analysis and preventive measures.
Shift-Based Performance Comparison
Compare performance metrics (OEE, output, downtime) between shifts or operators to identify best practices or training needs.
Interested in the OEE Machine fleet overview? Contact us today to learn more about the setup steps.
Contact: martijn.vandijk@stridata.com
Website: https://stridata.com/ixon/

.svg?date=2023-09-07%2009:39:31)